

Measuring Emissions for Consumer Devices
Overview of Emissions by Device
This graphic, from Malmodin and Lundén, is a useful overview of emissions from production vs use phase. Note that the numbers here are slightly different than the aggregated conclusions we draw below.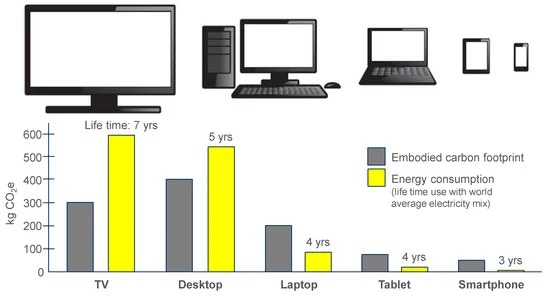
Calculating Lifecycle Emissions Per Second of Use
The Lifecycle Annual Footprint (LAF) of a particular device, per Belkhir and Elmeligi, is the Use Phase Energy (UPE) plus the Production Energy (PE) divided by the Useful Life (UL). In other words, “the Lifecycle Annual Footprint accounts for the annual footprint of both the use phase as well as the production energy, depreciating the production energy over the useful lifetime of the device.LAF = (UPE + PE) / UL
Production is done around the world, not where consumer use occurs, whereas we need to calculate the UPE based on the consumer’s grid mix. We calculate Production Energy per Use Second (PEPS) using the daily usage in hours (DU):
PEPS = PE / (365 • UL • DU • 3600)
To calculate the Lifecycle Emissions Per Second of Use (LEPS), we multiply the grid intensity of the consumer’s location (GI) and the usage energy of the consumer device (UEPS) and add this to the production energy per second (PEPS).
LEPS = PEPS + GI • UEPS
The following sections outline the sources and assumptions used to calculate these metrics for various device types. Note that, after the release of the October 2025 Emission Model, we use the default emission factors from version 1.2 of the Global Media Sustainability Framework (GMSF) for these consumer devices: TV, Phone, Tablet and Personal Computer.
Personal Computer
From Negaoctet:
From Urban et al:
Since we do not know the exact device a consumer is using (most reporting is aggregated to device type), we used to use the install base to create a synthetic “personal computer”. See PC emissions model. Based on this analysis, a personal computer uses an average of 53.2 W of energy while in use, and has Production Energy of 0.005 gCO2e per second of use.

Tablet
From Negaoctet, a “Tablet; use mix, personal or professional use; average configuration: 10.44 inches screen mix of LCD screen, 4 GB RAM, 121 GB memory, 3 years lifespan; RAS” has 25.3 kgCO2e per year of embodied emissions. We don’t have a stat on daily usage of tablets. Assuming that people use them in lieu of a laptop, taking the laptop number of 6.7 hours a day. This yields a PEPS of 0.00287 gCO2e/s. For energy use, iBatteryLife compares multiple iPad models and battery life is around 10 hours for each. The average iPad, per Sir Apfelot, has around 30 Wh of battery capacity. Thus, a tablet has an average power draw of 3W. We use the following defaults from GMSF 1.2: a use-phase energy intensity of 0.0000014 kWh per second (5.04 W power draw) and embodied emissions of 0.0000257 kgCO2e per second. The embodied emission factor is much higher than for the other devices due to considering low daily usage. The listed data source is ADEME (Base Empreinte, “Numérique 2.0” dataset, 2025).Smartphone
From Negaoctet, a “smartphone; use mix, personal use; average configuration: 6,61 inches screen mix of LCD and OLED technologies, 7,3 GB RAM, 180 GB memory, 2,5 years lifespan; RAS” has 33.6 kgCO2e per year of embodied emissions. The typical person uses her phone for 4 hours and 23 minutes a day per Statista. This yields a PEPS of 0.0058 gCO2e/s. (Note: SRI uses a 3 hrs/day number) As an example, per GSM Arena, the Apple iPhone 13 takes 16 hours and 8 minutes to run out of battery when browsing the internet (similar to video playback). In idle mode, it takes 174 hours to discharge. It has 12.41Wh of battery capacity per Macworld. Thus, the iphone consumes 0.77W when active, and 0.071W when idle. We use the following defaults from GMSF 1.2: a use-phase energy intensity of 0.0000013 kWh per second (4.68 W power draw) and embodied emissions of 0.00000655 kgCO2e per second. The use-phase value is considered conservative and based on video playback. The listed data source is ADEME (Base Empreinte, “Numérique 2.0” dataset, 2025).Television
From Urban et al:
We combine these using install base to create a synthetic “TV System” that represents the full power draw of the consumer setup. The weighted power draw of a typical setup is 87.4 watts.
From the Negaoctet database, the production emissions from a 45” television (98.6% LCD, 1.4% OLED) are 45 kgCO2e per year over an 8 year useful life.
Based on the above Urban data, 58.8% of TVs have set top boxes. From the Negaoctet data, the production emissions from a set top box are 7.22 kgCO2e per year for a “Modem; use mix, personal and professional use; xDSL, FTTx, 5 years lifespan; RAS”
Based on 3.9 hours/day of usage, the embodied emissions from a TV and set top box are 0.0096 gCO2e/s.
A detailed study of many TV models can be found at ecocostsavings.com, indicating that the average power draw of a TV in the US is 59W active, 0.5W standby. This data is not tied to a scientific study but does indicate that overall power usage may have declined since the Urban study above.
We use the following defaults from GMSF 1.2: a use-phase energy intensity of 0.000038 kWh per second (136.8 W power draw) and embodied emissions of 0.00000865 kgCO2e per second. The listed data source is ADEME (Base Empreinte, “Numérique 2.0” dataset, 2025).
Smart Speaker
From a NRDC report by Horowitz, Hardy, and Tian:
The weighted power draw of a typical smart speaker is 2.5 watts.
Assuming a use life of 3 years for a smart speaker (similar to a tablet) and 84 kgCO2e of impact from (Amazon Echo Dot LCA) and 3.5 hours/day of usage, the embodied emissions from a smart speaker are 0.0061 gCO2e/s.
Radio
Since we do not have deterministic data on the devices used to listen to a given radio spot, we define a “synthetic Radio system” representative of the average listener. Similar to the Television device, we calculate the average use and embodied impacts for each type of receiver and combine this with a usage distribution to get a representative number. Below, we detail our assumptions and sources for each component of the calculation.Device lifespan
Daily Usage
Embodied Emissions
Use Emissions
For the usage phase of Car Audio, we use the ADEME ARCEP approach considering the power consumption of a car radio to be equal to that of Hi-Fi systems, at 38 Wh/h. Using a thermal engine efficiency of 40%, an alternator efficiency of 80%, and an energy content of 8.9 kWh per liter of fuel, the volume of fuel required for the operation of the car radio over a given period of time is calculated.
We use an average Diesel oil combustion emission factors (2.7 kgCO2e/l) based on several sources:
- Road diesel (ADEME - France): 2.41 kgCO2e/l
- Diesel - 100% mineral diesel (BEIS/Defra - UK): 2.662 kgCO2e/l
- Diesel oil - Euro iii - heavy duty vehicles - transport (NGER - AU): 2.717 kgCO2e/l
118.75W from a diesel car engine: (38(W) / 0.8 (alternator) / 0.4 (thermal engine)).
- Converted in liters of diesel:
118.75 / 8900 = 0.0133 liter. - Converted in GHG emissions:
0.0133 * 2.7 = 0.036 kgCO2eper hour.
Linear Radio Consumption Distribution by Device
Synthetic Radio Device Profile
Summary
Notes and Caveats
- All of our data is US-centric and probably does not represent typical devices or configurations in less-wealthy countries.